

Notebook helpers
Sentences, charts and images drawn the way the dashboard draws them, for tables, photos and network activations.
Three modules turn records into sentences and charts, drawn and worded the way the dashboard shows them. They import lazily: import kaimei.tabular loads neither pandas nor matplotlib until a function needs them.
| Module | Functions | For |
|---|---|---|
kaimei.tabular | explanation_summary, plot_explanation (waterfall from the base value), counterfactual_summary, plot_counterfactual, compare_explanations (up to three models side by side), plot_insight, plot_insights | Models whose inputs are table rows. Pass model= to add units and the output's name. |
kaimei.images | load_image (resize-and-centre-crop like torchvision, EXIF rotation, the feature's value range), explanation_summary, render_explanation (heatmap, spotlight or original), evidence_images, numbered_regions, focus_mask, region_mask, overlay_heatmap, plot_explanation | Image models. Byte for byte the dashboard's rendering, NumPy and Pillow only. |
kaimei.activations | decode, stage, feature_maps, saliency, unit_values, class_attention, plot_activations (the dashboard's Sight strip) | What every layer computed, from client.models.activations. |
from kaimei.tabular import counterfactual_summary, explanation_summary, plot_explanation, plot_insight

model = client.models.retrieve("credit-default-forest")
explanation = client.explanations.create(
    model=model.slug, input=card_client, method="shap",
    options={"seed": 0, "counterfactual": True, "frozen_features": ["age", "credit_limit"]},
)
print(explanation_summary(explanation, model=model))
# The model predicts default: P(default) = 70.8%, against 25.3% on average over a sample of the reference data.
# Pushing P(default) up: repayment_status = 2 (+21.6 pts), worst_status_6m = 2 (+11.4 pts), prior_status = 2 (+8.9 pts).
print(counterfactual_summary(explanation, model=model))
# Changing worst_status_6m from 2 to 1 flips the decision to repay (age and credit_limit held fixed):
# P(default) 70.8% → 46.7%.
plot_explanation(explanation, model=model)
for insight in client.insights.list(model=model.slug).data:
    plot_insight(insight, model=model)
from kaimei.images import load_image, render_explanation, explanation_summary, plot_explanation
model = client.models.retrieve("cats-dogs-photos")
photo = load_image("my_dog.jpg", model=model) # the model's size and value range
explanation = client.explanations.create(model=model.slug, input={"photo": photo}, method="gradcam")
print(explanation_summary(explanation))
# The model looks mostly at the centre of the photo: half of its evidence for dog sits in 21% ...
render_explanation(photo, explanation).save("dog_gradcam.png")
render_explanation(photo, explanation, mode="spotlight").save("dog_spotlight.png")
plot_explanation(photo, explanation) # the dashboard's Explain viewfrom kaimei.activations import class_attention, feature_maps, plot_activations, saliency, stage
result = client.models.activations("cats-dogs-photos", input={"photo": photo}, channels=8)
last = stage(result) # the last detailed feature map
maps = feature_maps(last) # {channel: (h, w) array}, strongest first
where = saliency(last) # (h, w): mean |activation| over channels
plot_activations(result, image=photo)
focused = client.models.activations("cats-dogs-photos", input={"photo": photo},
nodes=[last["node_id"]], cam=[last["node_id"]], target="dog")
heat = class_attention(stage(focused, last["node_id"])) # (H, W) Grad-CAM in [0, 1]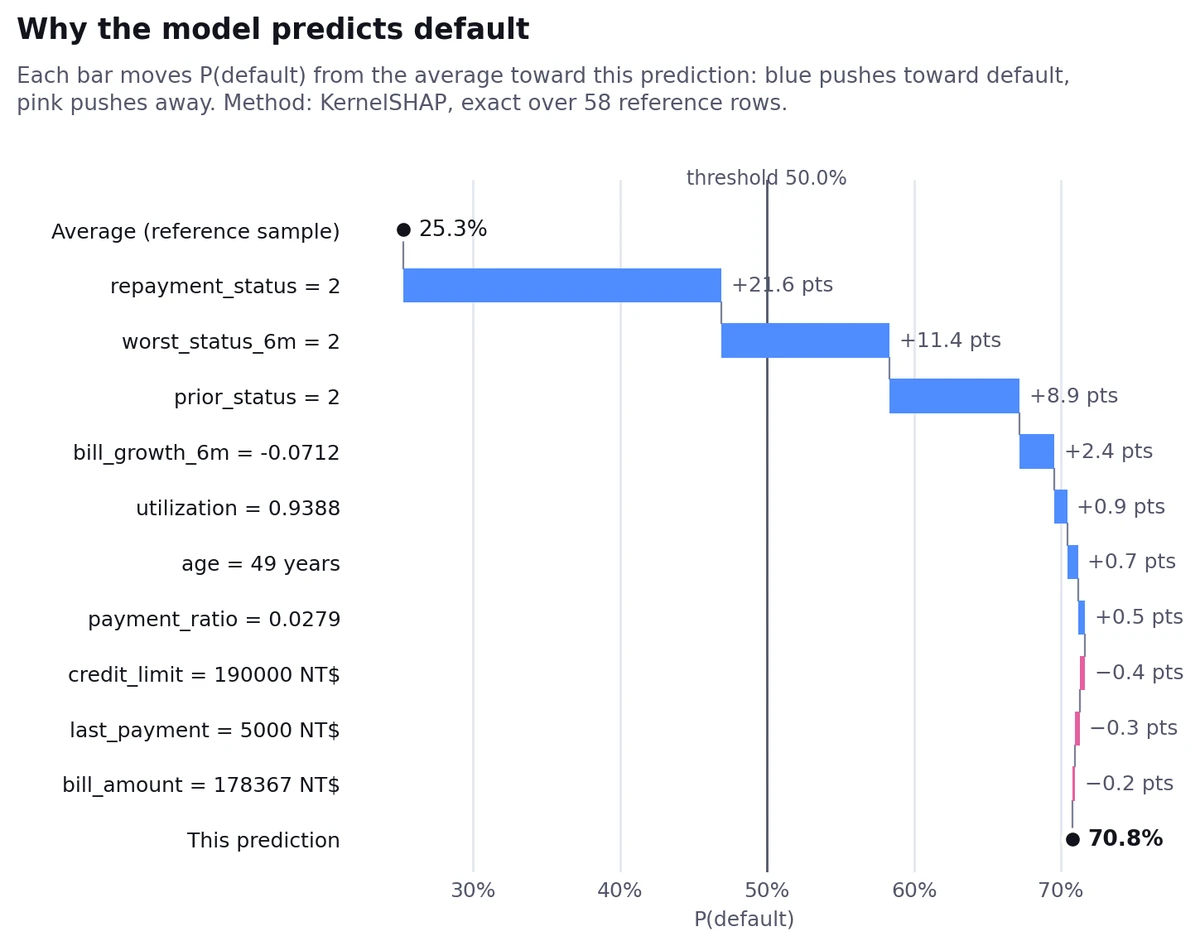
plot_explanation draws for the call above: a random forest on the public Default of Credit Card Clients data, explaining one held-out client. The banking example walks through the same client.