

New: worked examples for banking, markets, insurance, healthcare and energyNew: industry solutions

Every prediction,
explained. understood. defensible.

Kaimei attaches to the models you already run and tells you why each one decides what it decides. Then it watches them in production, so drift, bugs and regressions surface with their reasons attached.

pip install kaimei scikit-learn · PyTorch · TensorFlow · JAX · XGBoost

credit-default-forest · Explain
scikit-learn · random forest
raiseslowers
Default of Credit Card Clients POST https://api.kaimei.ai/v1/explanations
Frameworks
scikit-learn PyTorch TensorFlow Keras JAX XGBoost LightGBM CatBoost ONNX soon Hugging Face soon LLMs soon any HTTP endpoint
Explainability
KernelSHAP Permutation Shapley TreeSHAP LIME Integrated Gradients soon DeepLIFT soon Token attributions soon Grad-CAM Occlusion Saliency maps Counterfactuals Permutation importance Partial dependence ICE curves Feature interactions Learned rules Layer activations Weight-level traces your own attributions
Monitoring & robustness
Data drift · PSI Per-feature drift Output drift Prediction logging Output distributions Latency Severity alerts Version comparison Cross-model feature matrix Noise robustness Decision flip rate Fragile features Decision margins Performance vs outcomes Adversarial attacks soon Fairness metrics soon Data quality checks soon Attribution drift soon

Solutions

Wherever a model's answer has consequences.

A declined card, a mispriced policy, a patient sent home, a forecast that misses the peak. Each example below is a real model on public data, uploaded to Kaimei, with every number read back from the API.

Why Kaimei

Accuracy tells you what a model got right. It never tells you why.

Two models can agree on an answer and believe different things. On 30,000 real card clients, a random forest and a logistic scorecard give client 1105 the same chance of default: 54.6%. The forest reads one month late as mildly reassuring. The scorecard charges 8.1 points for it, then gives 5.1 points of credit for paying nothing at all. Kaimei makes those reasons visible for every model you ship, so you can tell which one you can defend.

Client 1105 · two models, one answerKernelSHAP · exact
input · valueForest · 54.6%Scorecard · 54.6%
Worst status, 6 months
+13.8
+14.1
Previous repayment
+11.2
+8.0
Credit limit
+2.5
+4.5
Balance change, 6 months
+1.9
+0.6
Latest repayment
−1.2
+8.1
Share of last bill paid
+1.1
−5.1
Last payment
+0.7
+1.4
Statement balance
−0.6
−0.7
Age
−0.2
±0.0
Utilisation
+0.1
+0.4
Percentage points of P(default), from each model's own average, as the Kaimei API returned them. Both models were trained on the same 24,000 clients and agree on 95.4% of the 6,000 held out.

Developers

A client that reads your notebook. An API that speaks plain REST.

The Python client uploads a fitted estimator in one call and turns explanations into sentences and charts. Every call is also a plain HTTP request, with typed errors and automatic retries.

from kaimei import Kaimei

client = Kaimei(api_key="km_live_...")

explanation = client.explanations.create(
    model="credit-risk-v3",
    prediction_id="pred_8f2a19",
    input={"income": 72000, "credit_score": 681, "utilization": 0.41},
    method="shap",
)

print(explanation.output)        # 0.81 decline
print(explanation.top_features)  # credit_score -0.22
from kaimei import Kaimei
from kaimei.tabular import plot_insight

client = Kaimei()  # KAIMEI_API_KEY from the environment

model = client.models.upload(
    clf,                       # scikit-learn, Keras/TensorFlow, PyTorch
    name="Churn v4",
    feature_names=FEATURES,
    X=X_train, y=y_train,      # reference rows explanations compare against
)

analysis = client.analyses.create(model=model.slug, type="full")
client.analyses.wait(analysis.id)
for insight in client.insights.list(model=model.slug).data:
    plot_insight(insight, model=model)
curl https://api.kaimei.ai/v1/explanations \
  -H "Authorization: Bearer km_live_..." \
  -H "Content-Type: application/json" \
  -d '{
    "model": "credit-risk-v3",
    "prediction_id": "pred_8f2a19",
    "input": {"income": 72000, "credit_score": 681, "utilization": 0.41},
    "method": "shap"
  }'

How it works

From a fitted estimator to a monitored model in four calls.

The client reads the live model in your notebook. Everything it learns also appears in the dashboard, for the people who never open a notebook.

01

Upload

One call reads the fitted estimator in your process and uploads its layers and weights. Kaimei never stores the original pickle, .h5 or .pt file.

client.models.upload(clf, name="Churn v4", X=X_ref, y=y_ref)
02

Explain

Ask why for any input. KernelSHAP, permutation Shapley or LIME for tabular models; Grad-CAM, occlusion and LIME for images.

client.explanations.create( model="churn-v4", input=row, method="shap")
03

Analyse

Study the model as a whole: importance, learned rules, behaviour curves and interactions. Insights land in the dashboard as they finish.

client.analyses.create( model="churn-v4", type="full")
04

Monitor

Log what your stack already predicts, run shadow models, and catch drift with the explanation that names the culprit.

client.predictions.create( model="churn-v4", input=row, output=out)

Platform

Explainability that holds up, from one prediction to the whole model.

Local attributions, counterfactuals, global analysis, versioning and production monitoring, in one place and under one API.

Local explanations, exact where it counts

For a model Kaimei runs itself with up to 12 inputs, KernelSHAP enumerates every feature coalition over a fixed reference sample. The answer is exact for that sample, and the same request returns the same numbers. Here, one declined card client under all three methods.

Client 1518 · P(default) 70.8%three methods, one decision
MethodLatest repaymentModel callsServer
KernelSHAP, exact+21.659,485167 ms
Permutation Shapley+21.845,122135 ms
LIME+16.451462 ms
The push of the strongest reason, in percentage points of P(default). The three agree on the order of the reasons; the exact method is the one to keep on file.
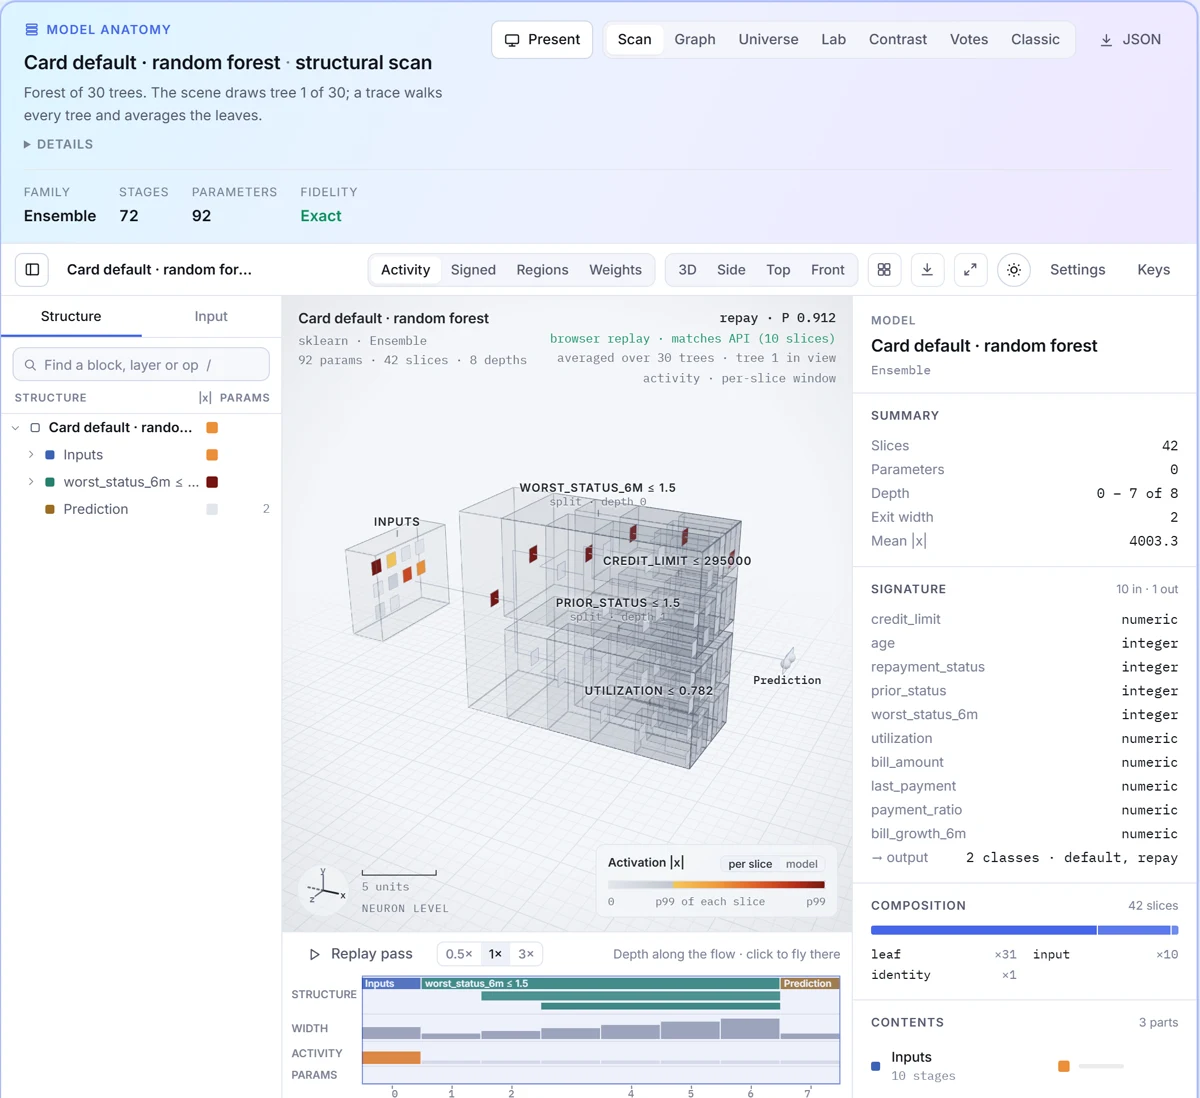
Model anatomy, replayed in your browser

Every layer, weight and bias of an uploaded structure is drawn, and a trace walks a prediction through it. Repeated blocks fold, so a 110M-parameter encoder stays readable.

Kaimei dashboard drawing the card default random forest: its ten inputs, one of its thirty trees with every split labelled, and the prediction

Counterfactuals

The smallest change that flips the decision, step by step, with the features you choose held fixed.

credit-default-forestClient 287
Latest repayment2 months late1 month late
held fixedAge · Credit limit
default 56.0%repay 25.0%

Production monitoring

Log predictions, run shadow models and measure drift per input. A feed that sends utilisation as a percentage shows up as significant drift within one batch, while only 2 of 500 decisions change.

Utilisation3.27
Balance change, 6 months0.04
Statement balance0.02
Credit limit0.02
Age0.02

PSI per input · 500 logged predictions against 5,000 reference clients · bars cut off at 0.5

Models that argue their case

Compare a challenger with the champion, or v2 with v1, by what each has learned. The same answer for different reasons is a result you can finally see.

forest
AUC0.776
P(default)54.6%
1 month late−1.2
paid nothing+1.1
scorecard
AUC0.738
P(default)54.6%
1 month late+8.1
paid nothing−5.1

Client 1105, as each model explains the same answer. Pushes in points of P(default).

Bring your own model

If Kaimei cannot run a model itself, it can still explain and monitor it. Point it at a scoring endpoint, send attributions you compute yourself, or upload shapes only and keep the weights at home.

Remote inference, any HTTP scoring URLinference="remote"
Pre-computed attributions, for example TreeSHAPPOST /v1/explanations
Private weights: shapes and statistics onlyweights="summary"

Images, with the evidence checked

Grad-CAM, occlusion and LIME on photos, drawn exactly as the dashboard draws them. Every heatmap comes with named regions, a focus region holding half the evidence, and a check of what the model says with that region hidden.

  • Keras and PyTorch CNNs, from MobileNet to ResNet and EfficientNet
  • Plain-English summary of where the model looked and whether it was enough
  • Works through a remote endpoint too
gradcamocclusionlimeinput_shape=(3, 224, 224)
  1. Model anatomy

    Inside the model, one prediction at a time.

    This is ResNet-50: fifty layers and 25.6 million parameters that turn a photo into one of 1,000 labels. One call, client.models.upload, hands it to Kaimei, which traces every layer and runs the network itself. The lane underneath is Kaimei. Scroll to watch it follow one prediction through.

  2. 01 · Input

    To the model, a photo is 150,528 numbers.

    224 by 224 pixels, each a red, a green and a blue value. Kaimei's load_image resizes and crops a photo exactly as the model expects, so the numbers it explains are the numbers the model saw.

  3. 02 · conv1

    Sixty-four filters look for edges.

    Each 7 × 7 filter slides across the photo two pixels at a time and writes a 112 × 112 map of where it fired. Kaimei keeps the eight strongest, and they drop into its lane.

  4. 03 · Residual stages

    Sixteen blocks, folded into four.

    The maps shrink from 56 × 56 to 7 × 7 while the channels grow from 256 to 2,048, and a skip connection carries each block's input around it. Kaimei folds repeated blocks so the network stays readable and taps every stage on the way through: client.models.activations returns what each one saw.

  5. 04 · Output

    1,000 classes. It says lighthouse. But why?

    Average pooling turns 7 × 7 × 2,048 into 2,048 numbers, and one dense layer scores every ImageNet class. Class 437, beacon or lighthouse, comes out on top. A prediction usually ends here. With Kaimei, this is where the explanation starts.

  6. 05 · Grad-CAM

    Kaimei follows the score back to the last feature map.

    Ask client.explanations.create for gradcam, and Kaimei measures how much each of the 2,048 channels moves the lighthouse score, then weighs the 7 × 7 map by it. The brightest cells did the most work.

  7. 06 · Evidence

    Brought to light, then checked.

    Kaimei lays the map over the photo, splits the photo into regions and marks the focus holding half the evidence. Then it asks the model again with the focus hidden and with only the focus kept, and says what it found in one plain sentence.

  8. Grad-CAM · occlusion · LIME

    Every layer drawn. Every prediction brought to light.

    Upload a Keras or PyTorch network, from MobileNet to ResNet and EfficientNet, and Kaimei does all of this for any photo: in the dashboard, in a notebook, or through one API call.

    How image explanations work

    The architecture is ResNet-50's. The photo is painted for this page, and its activations, heatmap and evidence numbers are illustrative; the summary is written from them by the same rules the API uses.

Dashboard

Everything in the API, visible to the whole team.

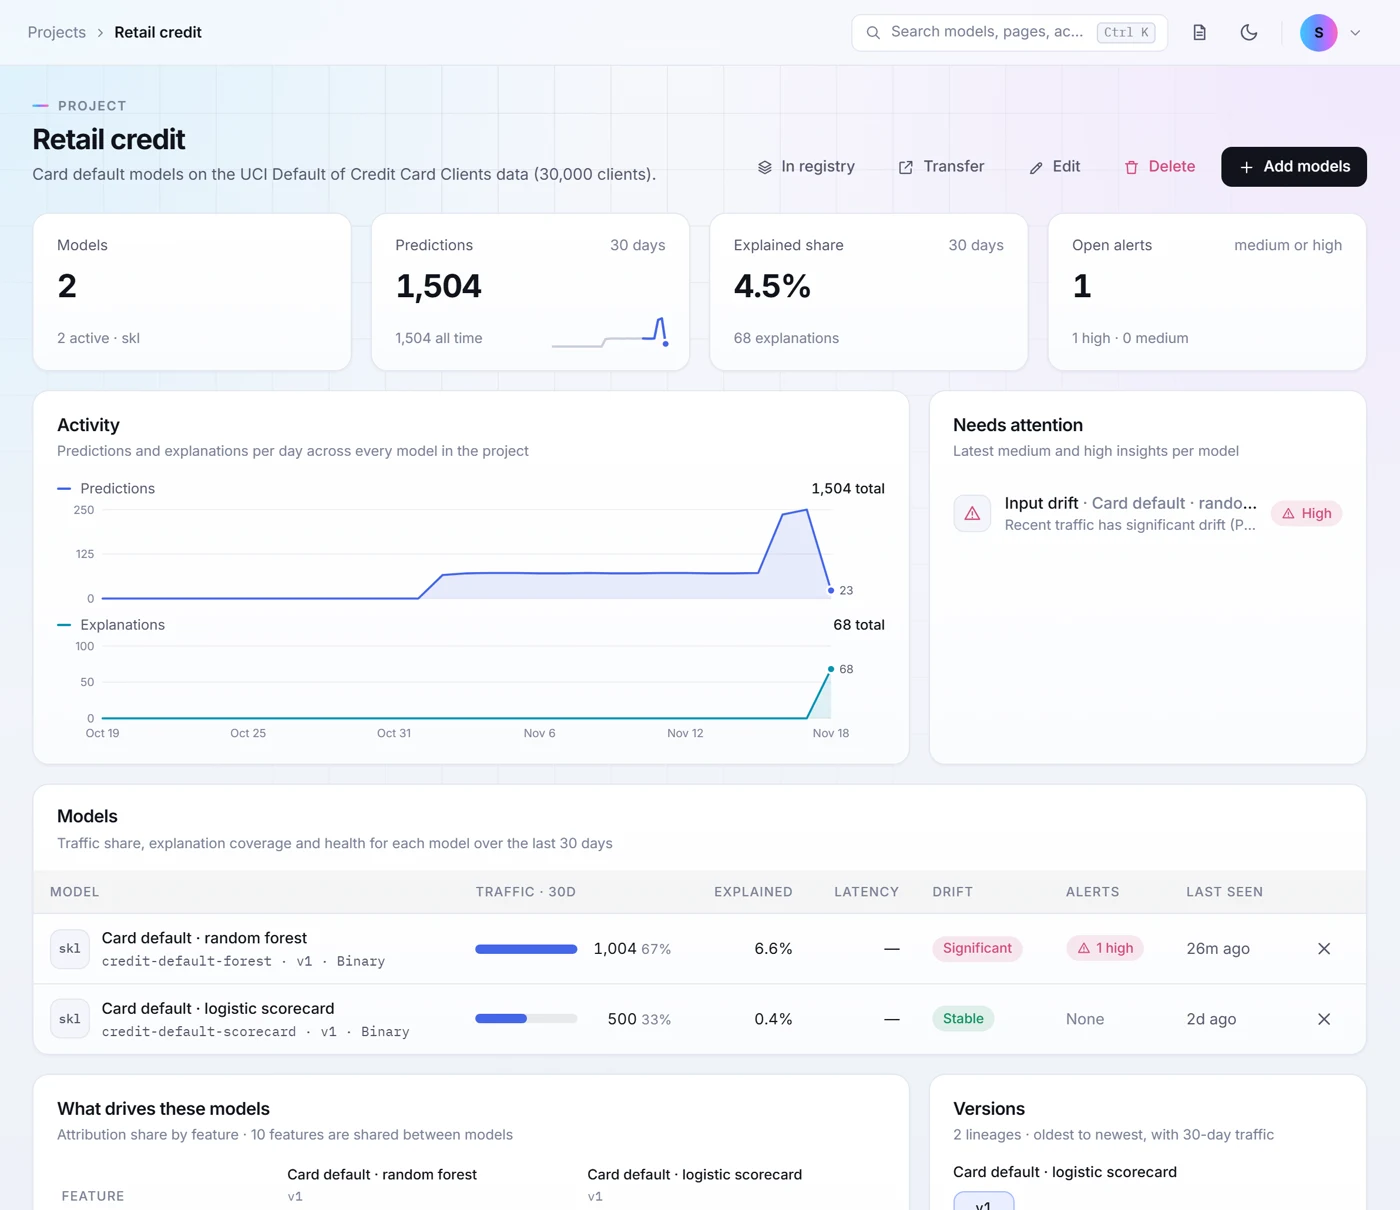
Each project shows traffic, explained share and open alerts across its models. Open a model to edit any feature and re-explain, read the insights an analysis produced, or walk the trees.

  • OverviewPredictions and explanations per day, drift and alerts per model
  • ExplainChange an input, pick a method, see the attributions move
  • InsightsImportance, rules, behaviour curves, interactions and drift
Kaimei dashboard project page for Retail credit: two card default models, their predictions and explanations per day, and a high input-drift alert on the random forest

Built for teams who answer for their models

Explanations you can put in front of a regulator, a customer or your own team.

01

Exact where it can be

Where the model is small enough, Kaimei enumerates every feature coalition rather than sampling. Deterministic requests mean the number in the report is the number in the API.

02

Private by design

Kaimei never stores your original model file. Upload shapes only and the weights stay in your environment. Point it at your own endpoint and the model never leaves at all.

What leaves your network
03

Open by default

The Python client is Apache 2.0. Every call is plain REST. The worked examples on this site use public datasets you can download, and the walkthrough notebooks run end to end in Colab.

Bring transparency to your models today.

Start on the free plan: 10 models, 500 explanations, 20 analyses and 5,000 logged predictions a month. No sales call required.